Care Map London
Who digital-first leaves out
A public-data model of who a digital-first NHS shuts out, and which change helps whom.
About
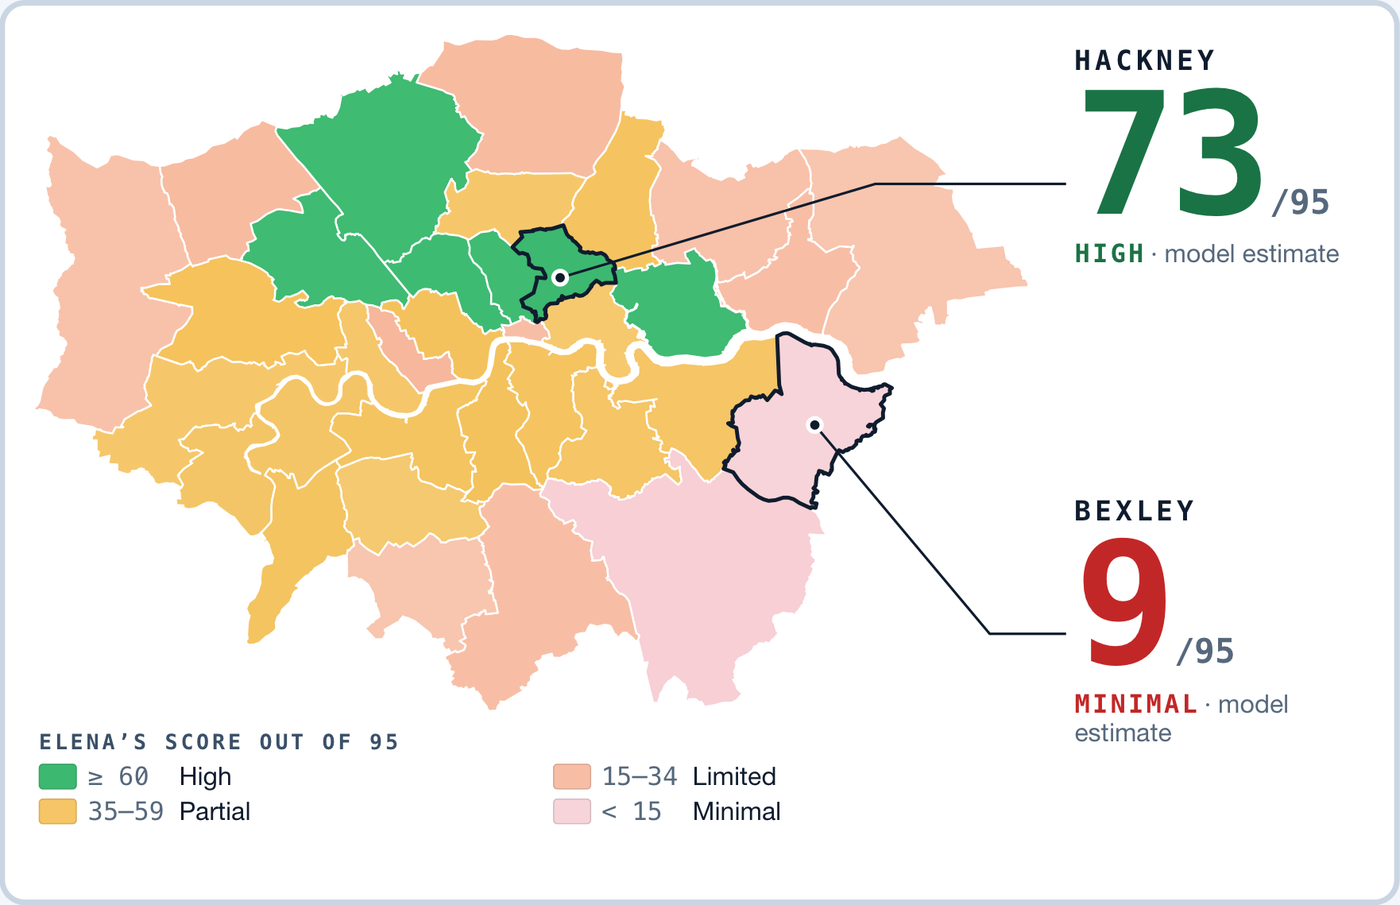
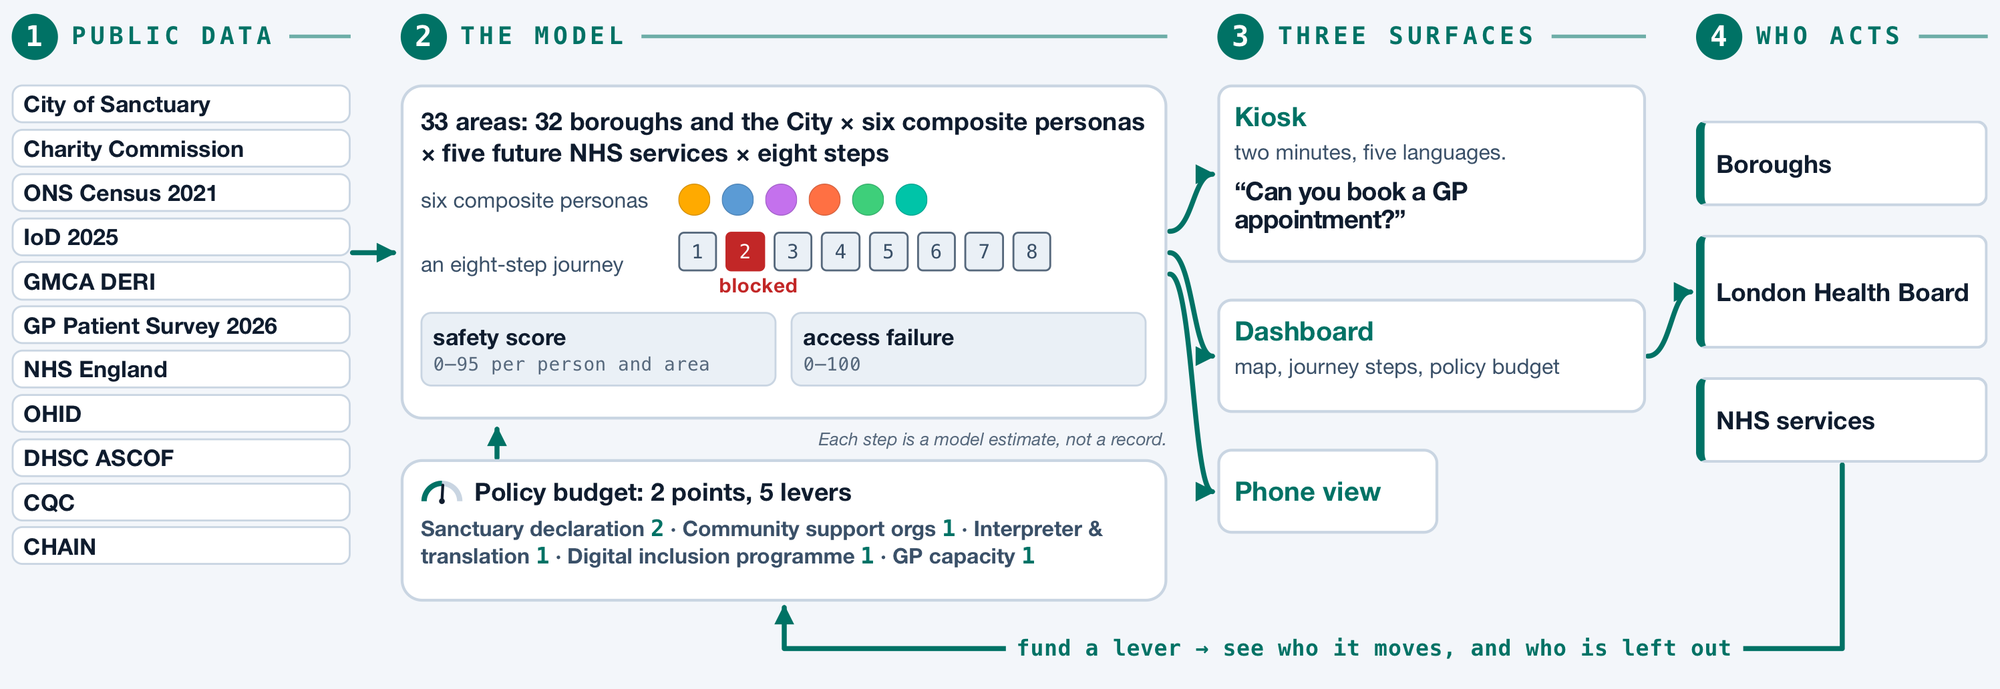
Care Map London is a decision-support instrument for boroughs, the London Health Board and NHS services. The London Health Mission’s brief notes that many communities in London have a healthy life expectancy 20 years shorter than people living just streets away. Digital-first NHS services can deepen it, shutting out people with no internet, ID, English or fixed address. Across 32 boroughs and the City, six composite personas try an eight-step GP portal: 129 of 198 plays stop before the end (model estimate). A two-minute kiosk and a dashboard with a two-point policy budget show who each change moves. The aim: help practitioners see who may not arrive, let NHS London test a service’s design before launch, and make patients’ access to care depend less on postcode.
Why it matters
How it works
- 1Try it at the kiosk — two minutesPick what makes care hard for you, pick where you live, then try a 2033 scenario — a fully digital GP portal — and see where it could stop you. Five languages, no app, no account.
- 2Bring your result to the tableThe dashboard shows a map, a safety score per persona and area, the eight journey steps, and a policy budget: 2 points across 5 levers. Who do you fund — and who do you leave out?
- 3Decide before launchBoroughs, the London Health Board and NHS services can see where each group stops and which change moves whom — before a digital service goes live.
Read the numbers as model estimates, not records. The six people are composite personas built from published research, not individuals. It is decision support for public services — not an app the excluded are expected to use.
Team & contact
Data: City of Sanctuary · Charity Commission · ONS Census 2021 · IoD 2025 · GMCA DERI · GP Patient Survey 2026 · NHS England · OHID · DHSC ASCOF · CQC · CHAIN. All figures are model estimates on public data.